
The challenge
A solid-form screen can produce hundreds or thousands of PXRD patterns. Most show the expected form. The ones that matter carry a little of something else: a second polymorph at a fraction of a percent, with peaks that sit among those of the main form.
Reviewing every pattern by eye does not scale, and on laboratory instruments the weakest signals are blurred into the background. The question was simple: how small an amount of an unwanted form can Exsolidus flag automatically, and how often does it raise a false alarm?
Data and conditions
- Material
- Model organic compound with two known polymorphs: 4-(tosylamino)benzoic acid
- Dataset
- Six simulated datasets of about 2,000 patterns each; second polymorph at 0, 0.1, 0.2, 0.3, 0.5, 1, 2, 3, 5 and 10 wt%
- Measurement
- Laboratory reflection profiles, 2θ 3–34°, six counting times from very short (scale 25) to long (scale 800)
- Analysis
- Exsolidus aberration removal, reference masking, peak search and profile-fit validation
Our approach
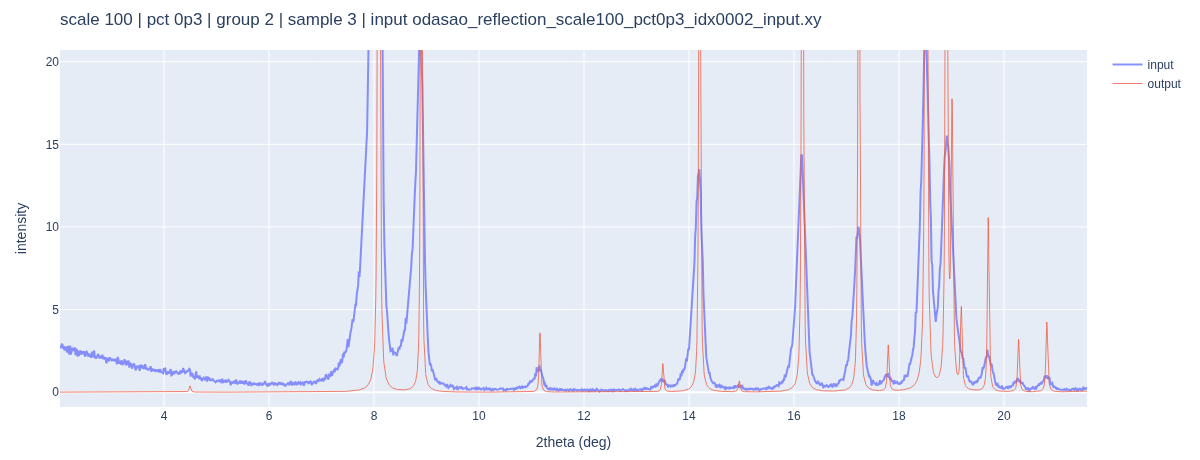
- Remove aberrations. Patent-pending technology turn each laboratory pattern into a sharp, near-noiseless one, so weak peaks stand clear of the background.
- Mask the main form. A reference pattern of the pure main form, supplied by you or inferred from the dataset, marks every region its peaks occupy.
- Search what is left. In the free regions, candidate impurity peaks are located in every pattern.
- Confirm before flagging. Each candidate is checked by profile fitting. A pattern is flagged only when at least one candidate passes.
Results
- 100%of patterns flagged at 1 wt% and above, at every counting time
- >90%flagged at 0.5 wt%, for all but the shortest scans
- 0.2 wt%detection limit with the longest scans; 0.5 wt% with the shortest
- ≤3%false positives on pure patterns; zero at the two longest counting times
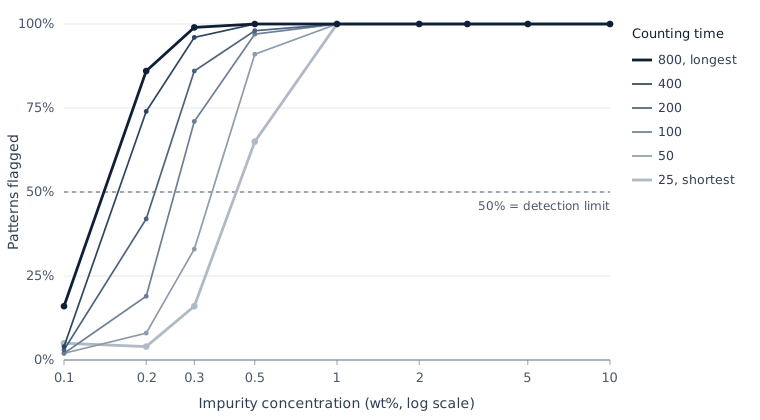
Sensitivity follows counting time. Longer scans move the detection limit from 0.5 wt% down to 0.2 wt%, so you can choose the scan length that matches the reporting level you need.
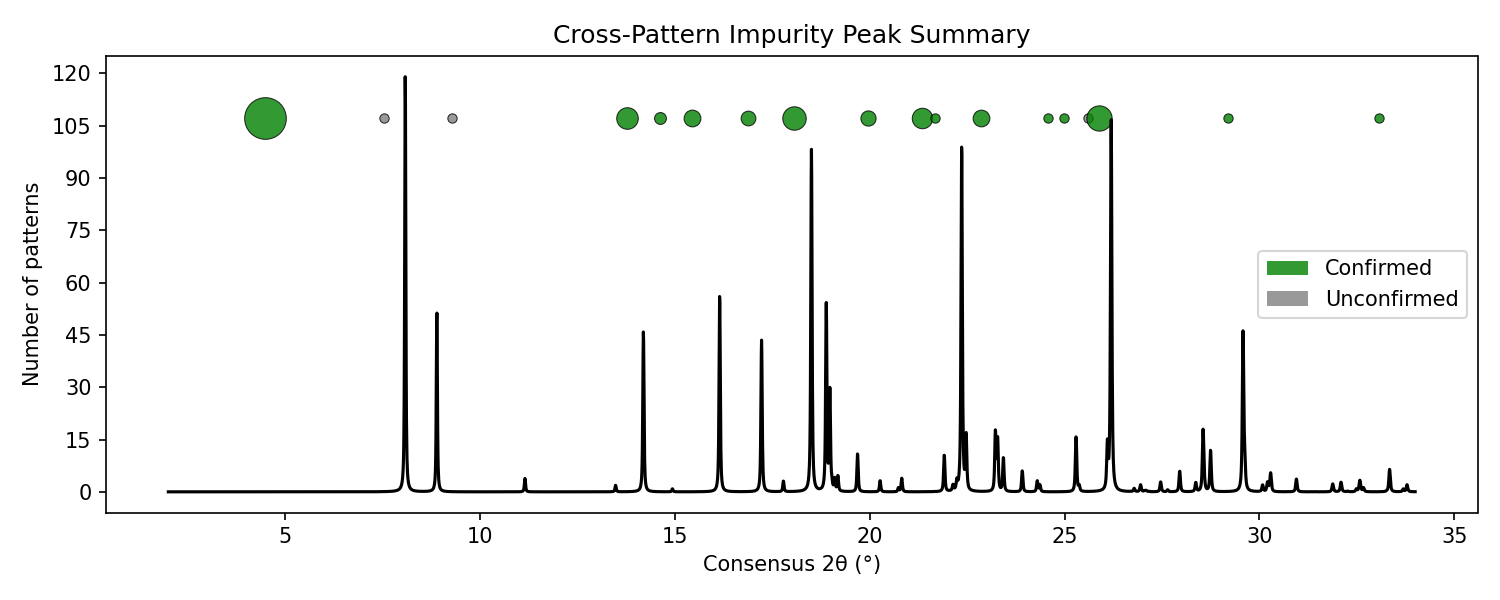
The detections are also consistent. Across hundreds of patterns and every impurity level, confirmed peaks cluster at the same positions, led by the impurity’s strongest low-angle peak at 2θ ≈ 4.5°. The few candidates near the main form’s peaks failed validation and were correctly rejected.
What it means for your screen
Exsolidus Screening turns thousands of patterns into a short list. Patterns with a trace second form are flagged automatically and consistently, so your scientists spend their time on the wells that changed, not on the hundreds that did not.
It works on the laboratory data you already collect, with a reference form you choose, or one inferred from the screen itself. Flagged patterns can go straight on to identification, structure determination or quantification in other Exsolidus modules.
Exsolidus can save your time
If you perform screening experiments and Send us a set of screening patterns and your reference form. We will show you which ones Exsolidus Screening flags, and why.
Discuss your screening data